Do structural breaks matter when forecasting?
tl;dr Should you worry about structural breaks when forecasting? Probably not as much as you think. And if you do, you can test for the importance of a structural break for your forecast using a new test.
Structural breaks have been pinpointed as one of the culprits for forecast failures in the past. In a well-known article, Stock and Watson (1996, JBES) point out that a wide range of U.S. macroeconomic time series suffer from structural breaks. However, they also found that modeling the breaks does not appear to lead to substantial improvements in forecast accuracy as measured by the mean square forecast error. They conclude that “statistically significant parameter variation might be only marginally significant from a forecasting perspective”. However, the latter has never been investigated formally even if the existence of breaks kept forecasters worried.
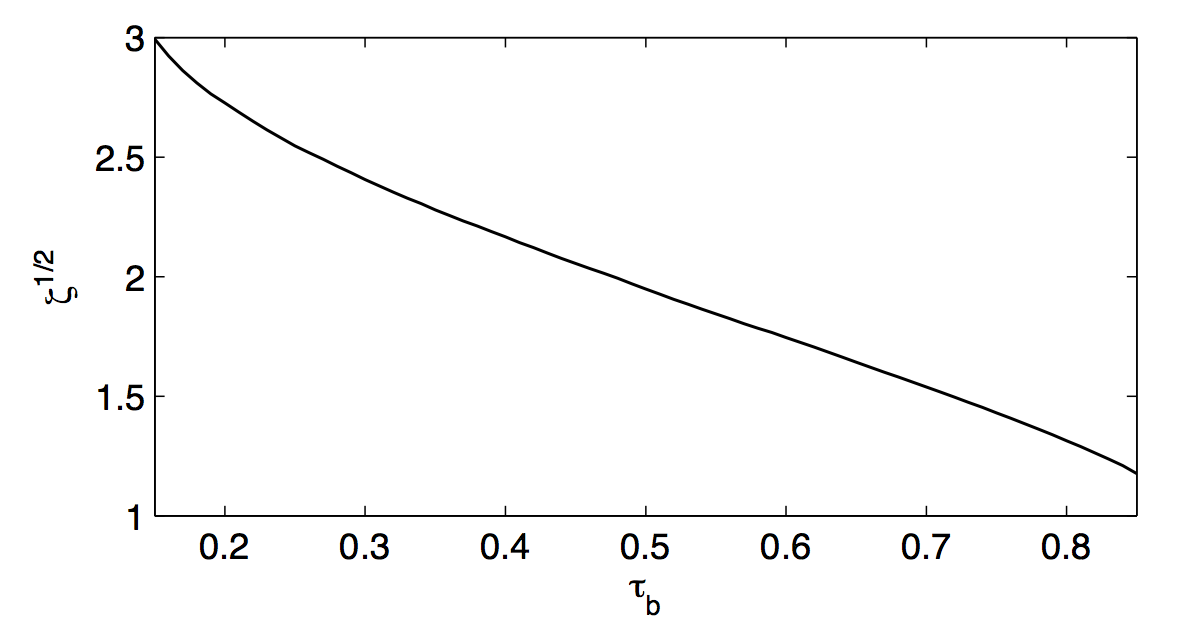
A new paper with Tom Boot remedies the situation. We develop a new test to assess whether the forecast from a model that takes a potential structural break in the estimation sample into account is more precise than that from a model that ignores breaks. Along the way, we establish that a structural break that should be modeled to improve forecast accuracy is very large. The graph below, which is from the paper with Tom, shows the minimum size of a break at which modeling it makes forecasts more precise. The size depends on the time of the break, which, as a proportion of the sample size, is on the x-axis. For example, 0.2 means that the break occurs after the first 20% of the observations. On the y-axis is the magnitude of the break of the forecast model standardized by the variance of the model. The graph therefore suggests that a break that is early in the sample will need to be three standard deviations of the distribution of the forecast model before one would want to model it. This break magnitude decreases as the break appears later in the sample but stays above one standard deviation.
How likely is it to encounter such a break? In the paper, we use the 130 time series in the FRED-MD data base and check for structural breaks in rolling windows of 10 years length. The graph below (also from the paper with Tom) shows the frequency of detecting a break for each series (sorted into eight categories and within each category by number of breaks) over the different rolling windows using the test of Andrews (1993, Econometrica), which is an in-sample test of parameter variation, as dashed lines and our test as solid lines. It is clear that Stock and Watson’s hunch is correct: Andrews’ test of parameter variation finds many more breaks across all series than our test of significance from a forecast perspective.
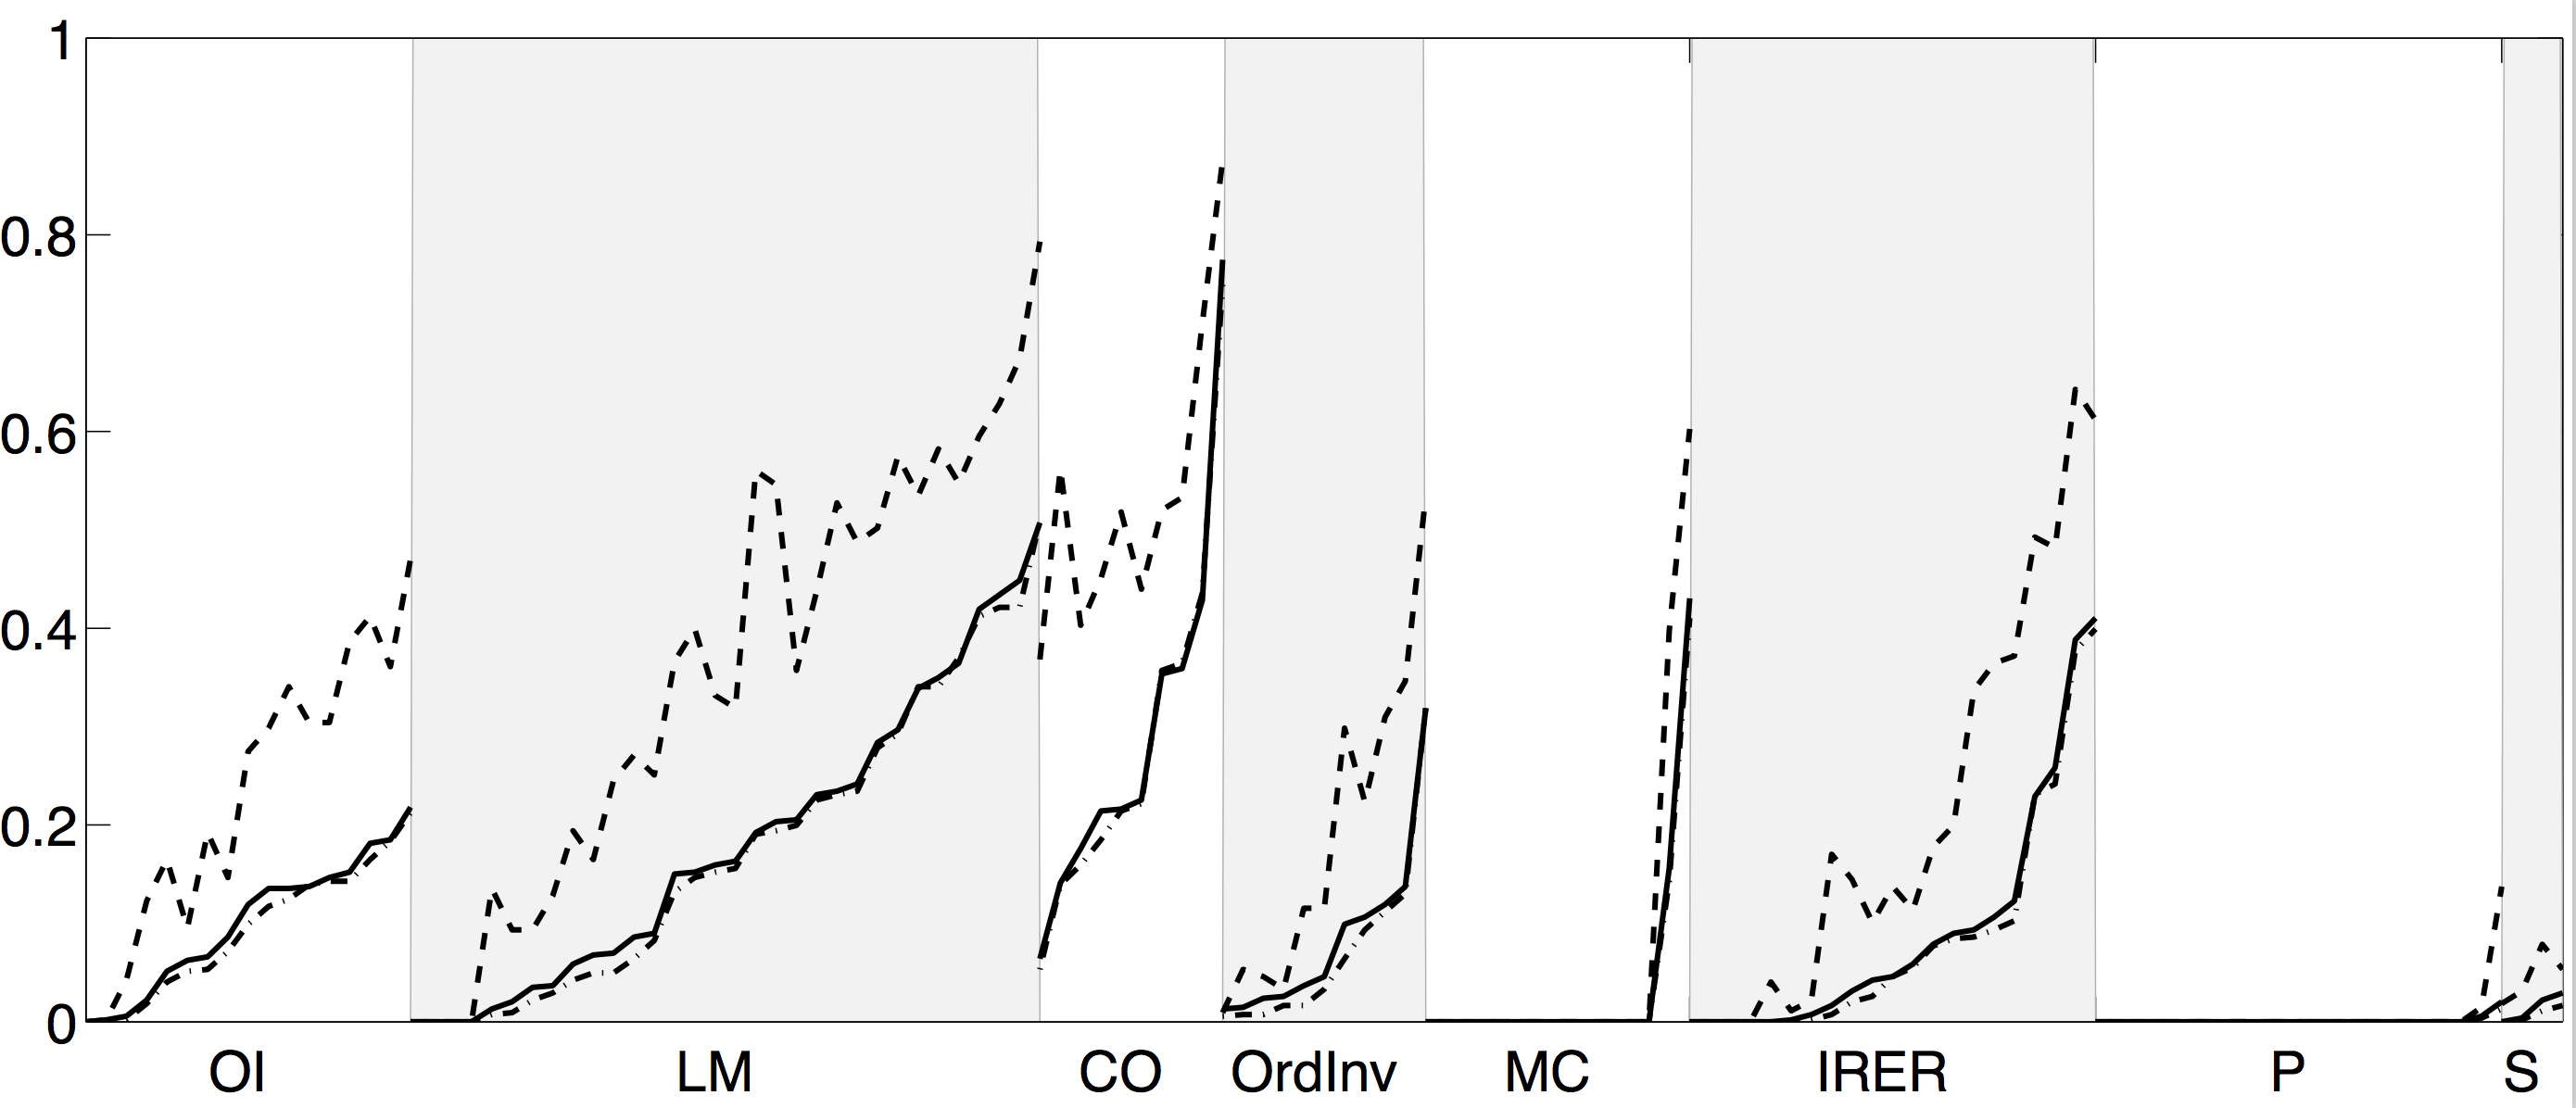
The eagle-eyed may have spotted additional dashed lines below the solid lines. These represents a variant of our test. But it is clear that, compared to Andrews’ test, the difference between our two variants is minimal.